Diminishing Returns 
The decrease in the rate of increase of an output due to a specific input.
The application of nitrogenous fertilisers is a good example of where this occurs. With an initial application of nitrogen fertiliser there is often a significant increase in grass growth, however, as more fertiliser is added the growth rate and overall mass of vegetation reduces to very small gains for each additional input of nitrogen.
For an agricultural crop requiring bulky quantities of grass for animal feed a rapid and excessive growth of grass is desired, and this requires a lot more nitrogen input than that required for sports turf situations. However, rapid growth and high volumes of vegetation are not required in sports turf. Some of the key requirements from a fertiliser programme include helping to develop a sward which is hard wearing, providing a dense sward of desirable grasses, resilience to external pressures (such as drought and disease) and provides a good quality playing experience, which is a composite of a range of factors; it is not to achieve maximum grass growth.
What does the concept of diminishing returns mean in practice for a sports pitch?
The input and resulting output, which might be considered as readily measurable criteria such as ground cover, sward density or root growth, which will have a direct effect on the carrying capacity for the pitch, needs to be related to the desired outcomes, which will typically be measured in terms of the quality achieved, carrying capacity and the cost of the inputs.
A number of value ratios can be created to help in making decisions as to the value of additional inputs and if the return is valued as being worthwhile. There will be a point at which the diminishing value of return is not considered worthwhile.
If a football or rugby pitch is used as an example, a table might be drawn up to help in a decision-making process.
Minimum criteria will typically be required, and in this example, it might be:
• A minimum quality rating of 40; AND
• A minimum carrying capacity of 1.0.
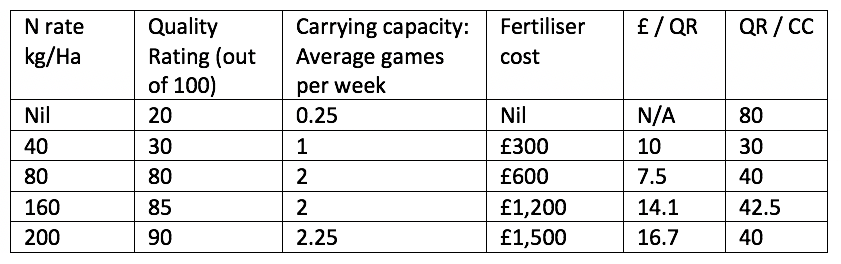
Row 3 has the
• Lowest cost input by a significant amount.
• Quality Rating of 11% less than the top rating.
• Carrying capacity of 11% less than the top rating.
• Lowest £ to QR ratio by a significant amount.
• Joint lowest QR / CC ratio (although they are all very similar).
A decision would then need to be made to determine the most appropriate outcome from the data available.
So, whilst row 3 doesn’t have the highest quality, the data is indicating that as a value for money option it is most likely the best option.
If financial resources were not a primary or highly weighted concern and quality rating and / or carrying capacity the most important deciding factor then row 5 would most likely be chosen, even though this is a much more expensive option.