Labour Profile 
A method used to aid in managing a surface or providing a service, by providing a visual and quantitative interpretation of a work programme, which should have been prepared beforehand.
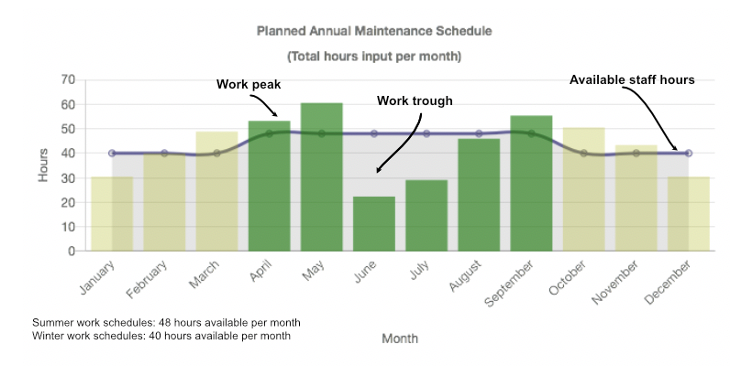
A chart is often used to show the workflow (in hours) of tasks throughout a year with the available staffing capacity (in hours) per unit period, which will typically be monthly, but could also be weekly where large numbers of people are involved. It is easy to see with this type of visual representation when work planning exceeds available capacity (work peak) and when excess capacity is available (work trough).
Where there is a work peak it might be possible to reschedule some work to other times, offer overtime, bring in temporary staff, contract out some work or recruit additional full-time staff.
Where there is a work trough then some of the peak work could be reallocated to this period, holidays could be encouraged, training programmes could be planned, or additional work could be planned to further improve a surface or service.
1. The frequency of the desired tasks per time period. For example, if the period is split into months then one instance of this might be mow 3 times per week during May, which could calculate as 12 occasions during that month (if a 4-week period is being allocated).
2. An estimate of the typical time to carry out each task.
3. The available staff capacity.
It is also called workforce profile, resource profile, visual resource profile and visual load profile.